2026 clay shrink-swell map: geology has not changed, risk has
France’s national exposure map for clay shrink–swell, known as RGA, has changed significantly. Yet clays, marls and superficial formations have not changed between two regulatory maps. What has changed is the real exposure to risk: climate, buildings, claims history and land use.
BRGM and the French State are updating the national exposure map for clay shrink–swell. Some municipalities change exposure level. Some areas move into medium or high exposure. Others remain stable.
The 2026 RGA map does not show a change in geology. It shows a reassessment of risk exposure: more intense droughts, exposed buildings, recent claims history and changes in the classification method.
Explore the map: zoom in on a municipality to see whether its clay shrink–swell exposure level increases, decreases or remains stable between 2020 and 2026.
Note: the official clay shrink–swell exposure map covers mainland France excluding the city of Paris. In this visualisation, Paris should therefore be read as outside the official perimeter of the RGA mapping.
At first sight, one might think the French subsurface has changed.
It obviously has not.
Geology is usually counted in thousands, millions, sometimes hundreds of millions of years. Clays, marls and superficial formations do not reorganise themselves between two regulatory decisions. What changes is not geology itself. What changes is actual risk exposure: more intense drought episodes, urbanised soils, modified vegetation, existing buildings and observed damage.
Geology is the support. Risk is an interaction.
A risk map, not a geological map
A geological map answers one question: what is beneath our feet?
A clay shrink–swell exposure map answers another question: where can this phenomenon damage buildings?
These are not the same thing.
Shrink–swell depends, of course, on the presence of sensitive clays. But it also depends on water, drought, vegetation, soil sealing, foundation depth, building quality, and the way damage is reported, assessed, recognised and compensated.
An RGA map is therefore not only a map of the subsurface. It is a map of exposure across inhabited territory.
Climate forces the system
The mechanism is simple in principle.
A clay soil can swell when it becomes wetter. It can shrink when it dries. These volume changes generate differential ground motion. A house built on this soil does not always move uniformly. Foundations are stressed. Walls crack. Doors jam. The structure suffers.
This phenomenon has existed for a long time.
What is changing today is the intensity and frequency of hydrological cycles. More severe droughts, repeated heatwaves, alternation between dry periods and rainfall returns: climate change does not create clays, but it makes their effects more frequent, more intense and more costly.
The map changes because the whole system changes: climate, soil, buildings, vegetation and land planning.
You cannot send a geologist into every garden
A national map necessarily generalises.
It cannot inspect every parcel, every house, every foundation, every sealed terrace, every tree planted too close to a wall, every drainage system or every leaking pipe.
It therefore has to build useful information at large scale.
To do so, exposure maps combine several families of data: clay-rich formations, geological and geotechnical characteristics, hydrological context, claims history and feedback from recent droughts.
This is logical. But it requires one important clarification: claims history is not nature.
Claims history is not nature
A recognised claim is not only a geological signal. It is the result of a full chain.
First there is a physical system: clay soil, water deficit, rewetting and differential movement. Then there is a building, with its design, age, foundations and immediate surroundings. Then come the report, the municipal request, expert assessment, insurance, possible CatNat recognition, sometimes dispute and the courts.
In other words, claims history contains physics, but also administration, insurance, law, economics and territorial inequalities.
It is therefore valuable because it shows where the phenomenon actually produces damage. But it must be interpreted with caution. It does not only describe the soil. It also describes how a society builds, reports, recognises and compensates damage related to the ground.
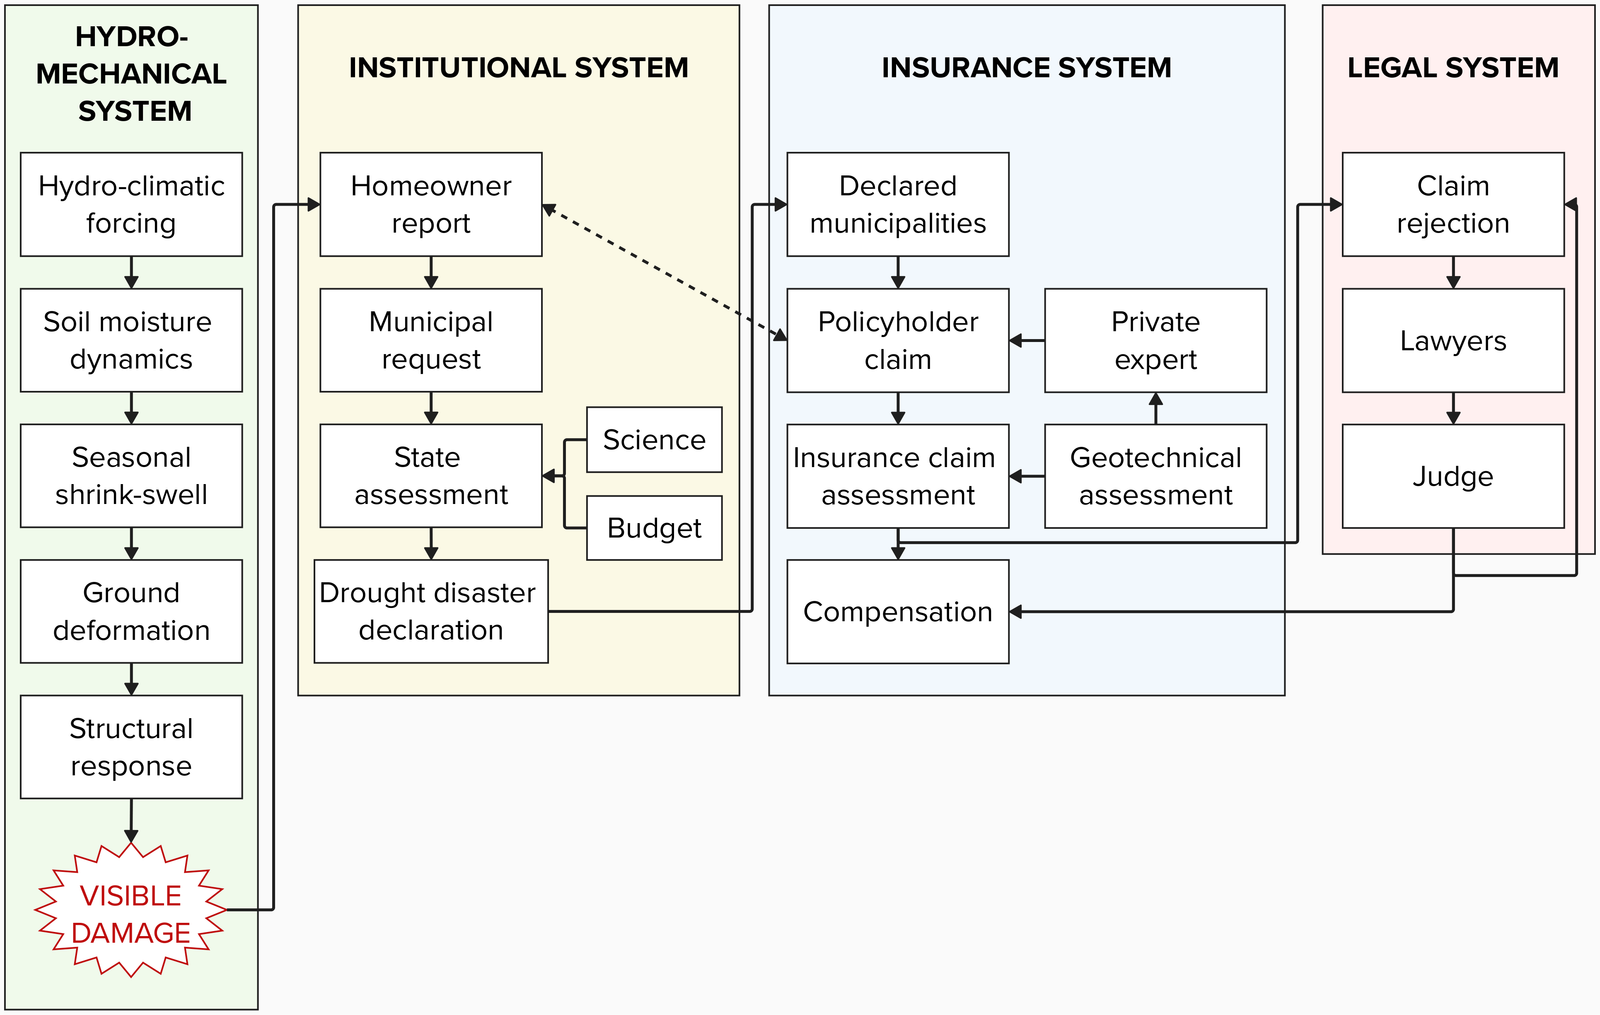
← Swipe horizontally to explore the diagram →
To be compensated under the French natural catastrophe scheme, the property must be insured for damage to goods and the municipality must be recognised as being in a state of natural catastrophe by an interministerial order published in the Official Journal. After publication of the order, the insured person has 30 days to report the damage to their insurer, which then assesses the case.
This chain is essential for understanding the new map. When claims history is used to improve an exposure map, it provides real information: where damage has been observed, reported, assessed and recognised. But it also carries the biases of the system that produces this recognition.
What the new map shows
The new map does not say that French geology has changed.
It says that regulatory exposure to clay shrink–swell is being reassessed using available knowledge, the effects of climate change and the strong recent claims history.
This distinction is essential.
A municipality moving from low to medium, or from medium to high exposure, has not transformed geologically. It is reclassified because its estimated exposure level becomes higher in light of available data.
The change is not marginal. According to BRGM and Géorisques, 55 % of mainland France is now in medium or high exposure to clay shrink–swell, compared with 48 % previously. The update notably incorporates around 240,000 RGA claims that occurred between 2018 and 2022, representing 58 % of all RGA claims since 1989.
The consequences are concrete: buyer information, sale of buildable land, individual house construction contracts, soil studies, prevention, insurance and local perception of risk. The new zoning applies from 1 July 2026 to preliminary sale agreements, final sale deeds for undeveloped buildable land and individual house construction contracts.
The method also changes
The update does not simply add recent claims. It also changes how they are read.
The map used since 2020 relied in particular on a density of claims per square kilometre of urbanised area. The 2026 update favours a claim frequency approach: the number of claims is related to the number of individual houses, calculated from the national building database.
This choice matters. Individual houses are much more exposed to clay shrink–swell than collective housing, especially because they often rely on lighter foundations. Relating claims to the number of individual houses therefore helps better read the actual exposure of vulnerable buildings.
The map therefore does not measure only a soil. It measures exposure: an interaction between clay-rich formations, climate, individual houses and observed claims.
What this map is not
The RGA map is a national regulatory exposure map. It does not replace a parcel-scale soil study.
Its reference scale is that of geological maps at 1:50,000: it indicates an exposure context, not the exact nature of the soil beneath each house.
A municipality classified as medium or high exposure is not uniformly exposed. Within the same territory, there may be sensitive clay areas, less affected sectors, vulnerable buildings and others less exposed.
Conversely, a municipality with low exposure at map scale may contain specific local situations: limited clay bodies, local weathering, clay-rich veneers or specific hydrological configurations.
The map is therefore not a house diagnosis. It is used to identify an exposure context, guide prevention, inform owners and buyers, and frame regulatory obligations.
The real issue: living on dynamic soil in an unstable climate
Clay soils are not inert. They react to water, roots, drains, embankments, foundations and land use.
For a long time, construction assumed that the ground was stable by default.
Climate change recalls a physical fact: soil is a dynamic system. It can shrink, swell, deform and transmit stresses to buildings.
The question is therefore no longer only: am I in a yellow, orange or red zone?
The real question becomes: how can a house, a street, a municipality or a territory become more resilient to a soil that reacts increasingly strongly to drought?
What fiñv aims to contribute
A national map is necessary. But it remains a first reading.
The challenge is now to move to local scale: compare maps, monitor municipalities, observe hydrological signals, and combine geological, climatic, satellite and insurance-related data.
Earth observation can contribute to this reading.
Radar satellites, InSAR, hydrological time series and geological data do not replace field expertise. But they make it possible to better see where soils move, where seasonal cycles are marked, where signals repeat and where some territories become more sensitive.
The aim is not to produce one more map.
The aim is to produce actionable indicators: for municipalities, homeowners, insurers, engineering offices and land planners.
Sources and data
This page is based on public resources from BRGM, Géorisques and the French State concerning the 2026 update of the clay shrink–swell exposure map, the zoning methodology, the RGA expert file and the natural catastrophe compensation scheme.
BRGM — national RGA exposure map 2026
BRGM indicates that the national clay shrink–swell exposure map is changing at the request of the French State in order to include strong recent claims history, especially after the 2022 drought. Around 240,000 RGA claims were reported between 2018 and 2022, representing 58 % of RGA claims recorded since 1989.
Retrait-gonflement des argiles: la carte nationale d’exposition évolue
Géorisques — RGA exposure map 2026
Géorisques states that the order of 9 January 2026 updates the RGA exposure map used since 2020 in order to include the effects of climate change and strong recent claims history. The new zoning applies from 1 July 2026 to preliminary sale agreements, final sale deeds for undeveloped buildable land and individual house construction contracts.
Géorisques — RGA expert file
The Géorisques expert file describes the clay shrink–swell phenomenon, possible consequences for buildings, prevention principles and interpretation limits of the map at local scale.
Géorisques — CatNat compensation
Géorisques describes the French natural catastrophe compensation scheme, the recognition conditions through an interministerial order published in the Official Journal, and the deadlines for reporting and compensation.
These sources describe regulatory exposure and a national prevention and compensation framework. They do not constitute a parcel-scale diagnosis and do not replace a local geotechnical study.
Continue reading
These articles extend this reading: understanding clay soils, understanding what InSAR actually measures, then crossing hydrological and CatNat signals at territorial scale.
Understanding clay soils and shrink–swell
Understanding InSAR and ground motion
When physical drought and insurance signals tell different stories
Understand mechanisms. Quantify dynamics. Decide.